Height and weight Last fall, as our first example of correlation, we looked at the heights and weights of some AP* Statistics students. Here are the scatterplot, the residuals plot, a histogram of the residuals, and the regression analysis for the data we collected from the males. Use this information to analyze the association between heights and weights of teenage boys.
Dependent variable is:WT(lb)
squared
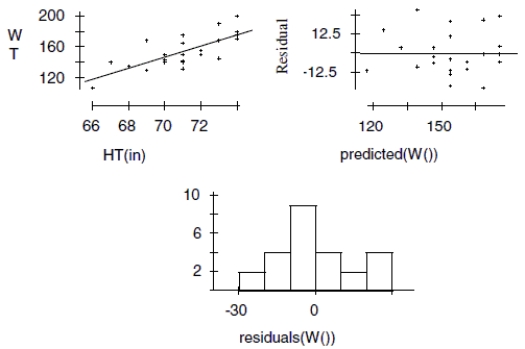
a. Is there an association? Write appropriate hypotheses. b. Are the assumptions for regression satisfied? Explain. c. What do you conclude?
d. Create a 95% confidence interval for the true slope.
e. Explain in context what your interval means.
Correct Answer:
Verified
View Answer
Unlock this answer now
Get Access to more Verified Answers free of charge
Q23: How many degrees of freedom are there
Q24: When two competing teams are equally
Q25: A high school counselor was interested
Q26: We want to know whether the categorical
Q27: Suppose you were asked to analyze
Q29: In a local school, vending machines
Q30: A San Jose State student collects
Q31: For the scenario described below, simply name
Q32: Of the 23 first year male
Q33: For the scenario described below, simply name
Unlock this Answer For Free Now!
View this answer and more for free by performing one of the following actions

Scan the QR code to install the App and get 2 free unlocks

Unlock quizzes for free by uploading documents