The following is a scatterplot of the average final exam score versus midterm score for 11 sections of an introductory statistics class: 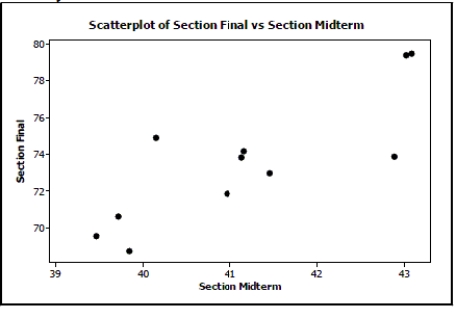
The correlation coefficient for these data is r = 0.829. If you had a scatterplot of the final exam score versus midterm score for all individual students in this introductory statistics course, would the correlation coefficient be weaker, stronger, or about the same? Explain.
Correct Answer:
Verified
View Answer
Unlock this answer now
Get Access to more Verified Answers free of charge
Q47: Breaking strength A company manufactures
Q48: Maple trees A forester would like
Q49: A silly psychology student gathers data on
Q50: High Score The longer you play
Q51: A study examined the number of
Q53: During a science lab, students heated
Q54: Subaru costs Data collected from internet
Q55: Identify what is wrong with each of
Q56: If the point in the upper left
Q57: Current research states that a good diet
Unlock this Answer For Free Now!
View this answer and more for free by performing one of the following actions

Scan the QR code to install the App and get 2 free unlocks

Unlock quizzes for free by uploading documents