Students A growing school district tracks the student population growth over the years from 2008 to 2013. Here are the regression results and a residual plot.
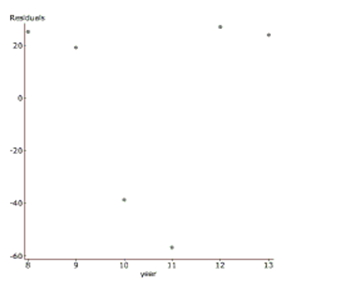
a. Explain why despite a high R-sq, this regression is not a successful model.
To linearize the data, the log (base 10) was taken of the student population. Here are the
results. Dependent Variable: (students)
Sample size: 6
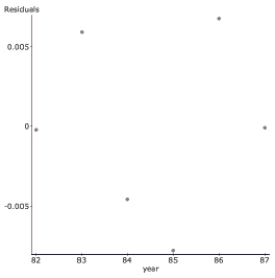
b. Describe the success of the linearization.
c. Interpret R-sq in the context of this problem. d. Predict the student population in 2014.
Correct Answer:
Verified
View Answer
Unlock this answer now
Get Access to more Verified Answers free of charge
Q13: Do you think a linear model is
Q87: On the axes below, sketch a scatterplot
Q88: Put to Work Some students have to
Q89: On the axes below, sketch a scatterplot
Q90: The following scatterplot shows a relationship between
Q91: An article in the Journal of
Q94: A plot of the residuals versus the
Q95: Shrimp From 1982 to 1990, there
Q96: Mistakes. Describe the mistake made in the
Q97: Associations For each pair of variables, indicate
Unlock this Answer For Free Now!
View this answer and more for free by performing one of the following actions

Scan the QR code to install the App and get 2 free unlocks

Unlock quizzes for free by uploading documents