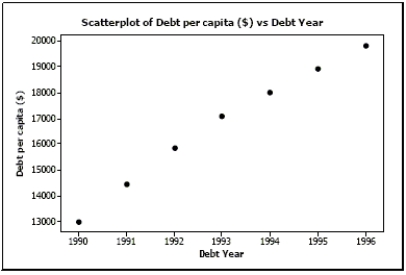
Personal debt According to The World Almanac and Book of Facts 2004, the debt per capita for the years 1990-2001 gives the following scatterplot: 
Regression output gives the equation of the regression line as (Year) with .
a. What is the response variable?
b. What is the correlation coefficient r?
c. Explain in context what the slope of the line means.
d. Explain in context what means.
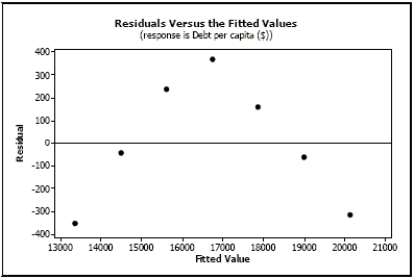
e. You decide to take a look at a residuals plot before making any predictions. Based on the following residuals plot, does linear regression seem appropriate for these data? Explain. 
Correct Answer:
Verified
View Answer
Unlock this answer now
Get Access to more Verified Answers free of charge
Q6: Interpret the intercept of your model in
Q17: Interpret the slope of your model in
Q17: Interpret the slope of your model in
Q106: During a science lab, students heated
Q108: The average movie ticket prices in
Q109: During a science lab, students heated
Q112: The bigger the stop sign, the
Q113: Halloween is a fun night. It
Q114: Associations For each pair of variables, indicate
Q116: Storks Data show that there is a
Unlock this Answer For Free Now!
View this answer and more for free by performing one of the following actions

Scan the QR code to install the App and get 2 free unlocks

Unlock quizzes for free by uploading documents