The standard deviation of the data displayed in this dotplot is most likely to be… 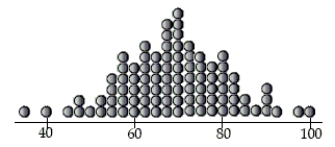
A) 5
B) 20
C) 12
D) 18
E) 8
Correct Answer:
Verified
Q9: The SPCA collects the following data about
Q10: Which type of plot would be least
Q11: Suppose that a Normal model described student
Q12: If we want to discuss any gaps
Q13: Suppose that a Normal model describes fuel
Q15: The advantage of making a stem-and-leaf display
Q16: Which variable about German Shepherds is most
Q17: Which of these variables is most likely
Q18: Suppose that a Normal model describes the
Q19: The five-number summary of credit hours
Unlock this Answer For Free Now!
View this answer and more for free by performing one of the following actions

Scan the QR code to install the App and get 2 free unlocks

Unlock quizzes for free by uploading documents