Auto insurance The Insurance Institute for Highway Safety publishes ratings for all models of vehicles to compare the relative risk of payouts. 100 is the mean rating for all vehicles. A rating of 122 means the vehicle is 22% worse than average. The table shows the summary statistics for the collision ratings of 27 midsize cars.
a. Were any of the ratings outliers? Show how you made your decision.
b. A histogram of the data is shown. Is it more appropriate to use the mean and standard
deviation, or the median and IQR to describe these data? Explain. 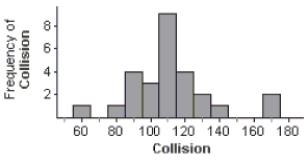
Correct Answer:
Verified
View Answer
Unlock this answer now
Get Access to more Verified Answers free of charge
Q31: In June 2003 Consumer Reports published an
Q45: Embryonic stem cells A Pew Research
Q46: In order to plan transportation and
Q47: The boxplots show prices of used cars
Q48: A survey conducted in a college
Q49: Commuting to work The table shows
Q51: City planners wanted to know how
Q52: During a budget meeting, local school
Q53: At a large business, employees must report
Q55: A research company frequently monitors trends
Unlock this Answer For Free Now!
View this answer and more for free by performing one of the following actions

Scan the QR code to install the App and get 2 free unlocks

Unlock quizzes for free by uploading documents