Health Insurance The World Almanac and Book of Facts 2004 reported the percent of people not covered by health insurance in the 50 states and Washington, D.C., for the year 2002. Computer output gives these summaries for the percent of people not covered by health insurance:
a. Were any of the states outliers? Explain how you made your decision. b. A histogram of the data is as follows: 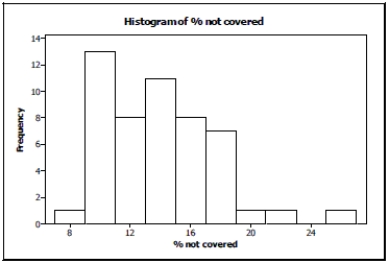
Is it more appropriate to use the mean and standard deviation or the median and IQR to describe these data? Explain.
Correct Answer:
Verified
1.5(IQ...
View Answer
Unlock this answer now
Get Access to more Verified Answers free of charge
Q5: To determine if people's preference in dogs
Q16: Has the percentage of young girls drinking
Q96: Has the percentage of young girls
Q98: Paying for purchases One day a
Q99: On Monday, a class of students took
Q101: Suppose a Normal model describes the number
Q102: Your Stats teacher tells you your test
Q103: Which is true of the data whose
Q104: Which is true of the data shown
Q105: Which of the following summaries are changed
Unlock this Answer For Free Now!
View this answer and more for free by performing one of the following actions

Scan the QR code to install the App and get 2 free unlocks

Unlock quizzes for free by uploading documents