The following graph shows the kinetics curves for the reaction of oxygen with hydrogen to form water:
O2(g) + 2H2(g) 2H2O(g) . Which curve is hydrogen? 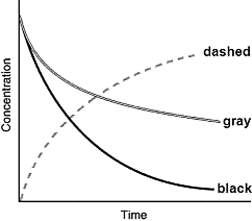
A) the dashed curve
B) the gray curve
C) the black curve
D) either the gray or the black curve
E) Any of these curves could be hydrogen.
Correct Answer:
Verified
Q2: Indicate which of the following compounds is
Q18: NO2 concentrations during photochemical smog events often
Q19: One reaction that occurs in an
Q21: A scientist conducts an experiment to
Q22: One reaction that occurs in an
Q24: HI dissociates to form I2 and
Q25: A scientist conducts an experiment to
Q26: One reaction that occurs in an
Q27: The disappearance of HI in the
Q28: One reaction that occurs in an
Unlock this Answer For Free Now!
View this answer and more for free by performing one of the following actions

Scan the QR code to install the App and get 2 free unlocks

Unlock quizzes for free by uploading documents