The heating curve for a substance is shown below. The substance initially is a solid. It then becomes a liquid and a gas. Which of the line segments (I-V) represents the solid to liquid phase transition? 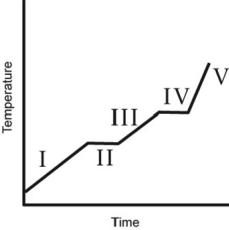
A) I
B) II
C) III
D) IV
E) V
Correct Answer:
Verified
Q42: The change in enthalpy and the change
Q46: How much work does a gas do
Q47: How much energy is needed to change
Q48: A pot of water is heated
Q48: The best definition of the enthalpy change
Q49: You hold a 50 g sphere of
Q50: The cooling system in an automobile holds
Q52: During an exothermic process, _ for
Q53: How much energy is needed to change
Q56: Which of the following relationships among the
Unlock this Answer For Free Now!
View this answer and more for free by performing one of the following actions

Scan the QR code to install the App and get 2 free unlocks

Unlock quizzes for free by uploading documents