Given that the number of U.S. 10th graders who were alcohol-free was 50% more than the number who had used alcohol, find the missing data.
A) 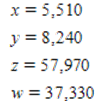
B) 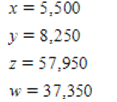
C) 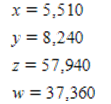
D) 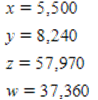
E) 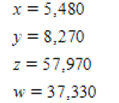
Correct Answer:
Verified
Q10: In November, 2003, the four organizations
Q11: Significant numbers of tourists traveled from North
Q12: In November 2003, the four companies
Q13: Boeing 747s seat 400 passengers and are
Q14: Urban Community College is planning to offer
Q16: You own a hamburger franchise and are
Q17: Electric current measures (in amperes, or
Q18: The chart below shows the amount
Q19: In 2000, total revenues from sales of
Q20: Use the table and the given
Unlock this Answer For Free Now!
View this answer and more for free by performing one of the following actions

Scan the QR code to install the App and get 2 free unlocks

Unlock quizzes for free by uploading documents