The chart shows the number of research articles in the prominent journal Physics Review that were written by researchers in Europe during 1983 - 2003 ( represents 1983) . 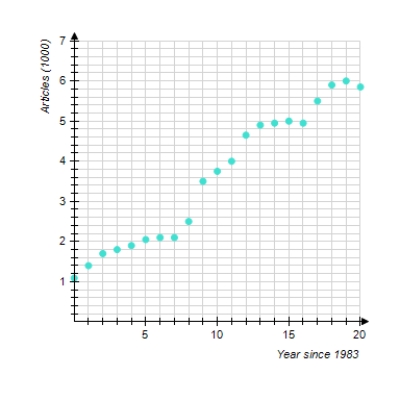
Which of the following logistic functions best models the data ( t is the number of years since 1983.) Try to determine the correct model without actually computing data points.
A)
B)
C)
D)
According to the model you selected, at what percentage was the number of articles growing around 1984
__________%
Correct Answer:
Verified
Q22: Choose the logistic function that best
Q23: Soon after taking an aspirin, a patient
Q24: How long, to the nearest year,
Q25: You are trying to determine the half-life
Q26: Convert the exponential function to the
Q28: Find the associated exponential decay model.
Q29: Convert the exponential function to the
Q30: How long will it take an investment
Q31: Use logarithms to solve the equation.
Q32: Graph the function.
Unlock this Answer For Free Now!
View this answer and more for free by performing one of the following actions

Scan the QR code to install the App and get 2 free unlocks

Unlock quizzes for free by uploading documents