Graph shows the number of sports utility vehicles sold in the United States. represents sales in year t in thousands of vehicles. Find . 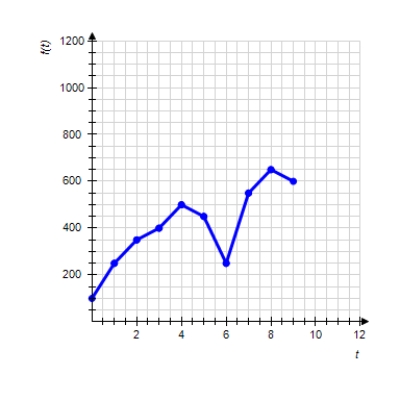
A) 400,000
B) 500,000
C) 450,000
D) 250,000
E) 600,000
Correct Answer:
Verified
Q104: Function f is
Q105: Function f is
Q106: Annual federal spending on Medicare increased more
Q107: Function f is
Q108: Choose the graph of the function
Q110: Function f is
Q111: Graph shows the number of sports
Q112: Use the graph of the function
Q113: Following are some approximate values of
Q114: Choose the graph of the function
Unlock this Answer For Free Now!
View this answer and more for free by performing one of the following actions

Scan the QR code to install the App and get 2 free unlocks

Unlock quizzes for free by uploading documents