Short Answer
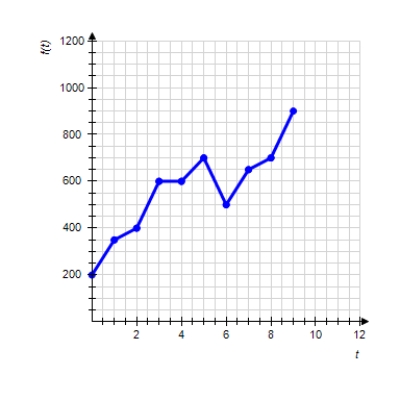
Graph shows the number of sports utility vehicles sold in the United States. represents sales in year t in thousands of vehicles. Use the graph to estimate the largest value of for .

Please enter your answer as a number without the units.
Correct Answer:
Verified
Related Questions
Q114: Choose the graph of the function
Q115: Choose the graph of the function
Q116: Graph shows the number of sports
Q117: Graph shows the number of sports
Q118: The following table shows the approximate
Q120: The following table shows the approximate
Unlock this Answer For Free Now!
View this answer and more for free by performing one of the following actions

Scan the QR code to install the App and get 2 free unlocks

Unlock quizzes for free by uploading documents