Short Answer
Graph shows the number of sports utility vehicles sold in the United States. represents sales in year t in thousands of vehicles. Use the graph to estimate the smallest value of for .
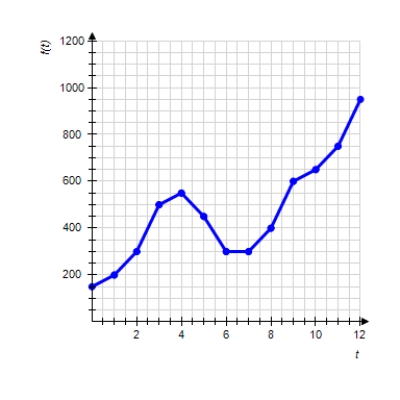
Please enter your answer as a number without the units.
Correct Answer:
Verified
Related Questions

