Refer to the following figure to answer the next questions.
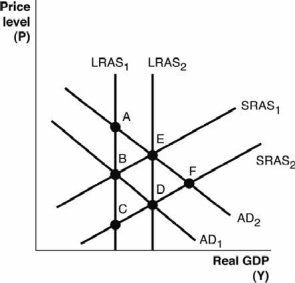
-Based on the figure, which of the following would cause the aggregate demand curve to shift from AD2 to AD1?
A) The economy has been producing more than its full-employment output level and wages and input prices begin to rise.
B) There is an increase in the price of oil.
C) There is an increase in the general price level that reduces real wealth.
D) There is a reduction in consumer confidence about future growth in the economy.
E) There is a reduction in income tax rates.
Correct Answer:
Verified
Q82: If the current short-run equilibrium level of
Q83: If short-run equilibrium output is above full-employment
Q86: A severe drought hits a country and
Q97: A severe drought hits a country and
Q98: Supply shocks always cause short-run aggregate supply
Q102: Refer to the following figure to answer
Q110: Suppose a change in health care laws
Q111: Refer to the following figure to answer
Q113: Suppose new drilling techniques increase the world
Q114: Refer to the following figure to answer
Unlock this Answer For Free Now!
View this answer and more for free by performing one of the following actions

Scan the QR code to install the App and get 2 free unlocks

Unlock quizzes for free by uploading documents