Figure 7.3. World Oil Market 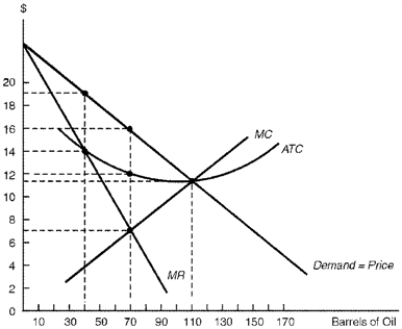
-Consider Figure 7.3.Under a profit-maximizing cartel, the quantity of oil produced equals
A) 40 barrels.
B) 70 barrels.
C) 90 barrels.
D) 110 barrels.
Correct Answer:
Verified
Q41: Import substitution is an example of
A) an
Q42: Recent trade patterns indicate that most of
Q43: Outward-oriented growth strategies emphasize
A) the allocation of
Q44: East Asian economies started enacting export-push strategies
A)
Q45: For most developing countries
A) productivity is high
Q47: Prior to the formation of OPEC, individual
Q48: Figure 7.3. World Oil Market 
Q49: Figure 7.3. World Oil Market
Q50: Developing countries tend to export _ because
Q51: All of the following nations EXCEPT _
Unlock this Answer For Free Now!
View this answer and more for free by performing one of the following actions

Scan the QR code to install the App and get 2 free unlocks

Unlock quizzes for free by uploading documents