Figure 13.2. The U.S. Market for Imported Toyotas
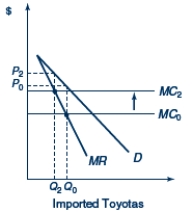
-In Figure 13.2, D represents the U.S.demand curve for Toyotas and MC0 represents the marginal cost of producing Toyotas.Assume that Toyota behaves like a monopolist in the U.S.market.A shift in the marginal cost curve from MC0 to MC2 leads to
A) a complete pass-through of the depreciation of the dollar.
B) a complete pass-through of the appreciation of the dollar.
C) a partial pass-through of the depreciation of the dollar.
D) a partial pass-through of the appreciation of the dollar.d
Correct Answer:
Verified
Q71: If a currency's exchange rate is overvalued,
Q72: A depreciation of the dollar results in
Q73: The purpose of currency devaluation is to
Q74: Currency devaluation is initiated by governmental policy
Q75: If a currency's exchange rate is undervalued,
Q77: Assume that General Motors employs labor and
Q78: Appreciation of the dollar's exchange value worsens
Q79: The purpose of currency revaluation is to
Q80: Assume that General Motors employs labor and
Q81: The J-curve effect implies that the price
Unlock this Answer For Free Now!
View this answer and more for free by performing one of the following actions

Scan the QR code to install the App and get 2 free unlocks

Unlock quizzes for free by uploading documents