The following figure shows the demand curves for baby formula.Which of the following changes is likely to happen if the price of baby formula increases?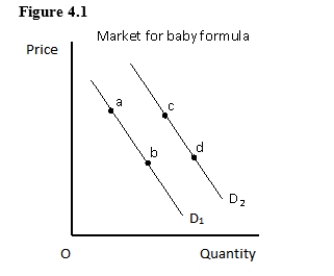
A) A shift in the demand curve from D1 to D2
B) A movement along demand curve D1 from point a to point b
C) A shift in the demand curve from D2 to D1
D) A movement along the demand curve D2 from point d to point c
E) A movement from point b on the demand curve D1 to point c on the demand curve D2
Correct Answer:
Verified
Q14: The following figure shows the demand curves
Q15: The income effect of a decrease in
Q16: The effect of a decrease in the
Q17: Other things constant,the demand for a product
Q18: The income effect of a decrease in
Q20: For a renter,the income effect of an
Q21: Which of the following statements about gold
Q22: Which of the following is most likely
Q23: Which of the following is most likely
Q66: Sugar and honey are viewed as substitutes
Unlock this Answer For Free Now!
View this answer and more for free by performing one of the following actions

Scan the QR code to install the App and get 2 free unlocks

Unlock quizzes for free by uploading documents