The figure given below shows the supply of baby formula.Which of the following is likely to result from an increase in the price of baby formula?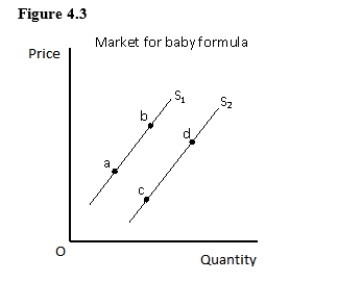
A) A movement from point a to point b on the supply curve S1
B) A leftward shift of the supply curve from S2 to S1
C) A movement from point d to point c on the supply curve S2
D) A rightward shift of the supply curve from S1 to S2
E) A movement from point b to point a on the supply curve S1
Correct Answer:
Verified
Q49: A supply curve typically slopes upward because:
A)opportunity
Q50: Which of the following is most likely
Q51: Which of the following will lead to
Q52: If the price of potato chips increases,other
Q53: In the figure given below that shows
Q55: Figure 4.2 shows the demand curves for
Q56: Figure 4.2 shows the demand curves for
Q57: Figure 4.4 shows the supply curve for
Q58: The market supply curve of a particular
Q59: As the baby boom ended,fewer families had
Unlock this Answer For Free Now!
View this answer and more for free by performing one of the following actions

Scan the QR code to install the App and get 2 free unlocks

Unlock quizzes for free by uploading documents