Figure 4.3 shows the supply curves for baby formula.In the figure given below,which of the following changes is likely to result from an increase in the number of firms producing baby formula?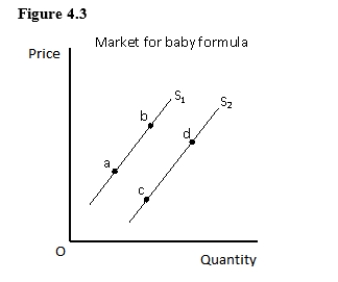
A) A rightward shift of the supply curve from S1 to S2
B) A movement from point a to point b on the supply curve S1
C) A leftward shift of the supply curve from S2 to S1
D) A movement from point c to point d on the supply curve S2
E) A movement from point b to point a on the supply curve S1
Correct Answer:
Verified
Q55: Figure 4.2 shows the demand curves for
Q56: Figure 4.2 shows the demand curves for
Q57: Figure 4.4 shows the supply curve for
Q58: The market supply curve of a particular
Q59: As the baby boom ended,fewer families had
Q61: The supply of index cards is likely
Q62: Which of the following will indicate a
Q63: Which of the following is likely to
Q64: Which of these is likely to increase
Q65: A surplus of shoes will cause:
A)a decrease
Unlock this Answer For Free Now!
View this answer and more for free by performing one of the following actions

Scan the QR code to install the App and get 2 free unlocks

Unlock quizzes for free by uploading documents