The figure given below depicts the milk market.The horizontal line,P,represents a price ceiling imposed by the government.Which of the following is true?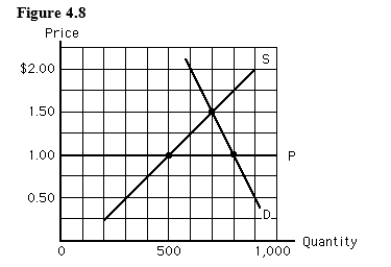
A) In equilibrium,the quantity demanded is 800 gallons.
B) There is a surplus when price per gallon is $1.
C) The quantity demanded at the price ceiling will equal the quantity produced.
D) The equilibrium price would be $1 per unit without the price ceiling.
E) The quantity supplied at the price ceiling is 500 gallons.
Correct Answer:
Verified
Q58: The slope of the demand curve for
Q132: In the figure given below,which of the
Q133: Demand for an inferior good decreases as
Q134: Suppose a price floor for a good
Q135: Rent controls usually result in:
A)an economic profit
Q136: The impact of a $200 increase in
Q138: When suppliers of a good that can
Q139: In the figure given below,a price floor
Q141: Markets tend to increase the costs of
Q142: Disequilibrium occurs due to the absence of
Unlock this Answer For Free Now!
View this answer and more for free by performing one of the following actions

Scan the QR code to install the App and get 2 free unlocks

Unlock quizzes for free by uploading documents