The figure below shows the aggregate demand and supply curves for the U.S.In this figure,as the aggregate demand curve shifts from AD to AD',the equilibrium price level in period 1: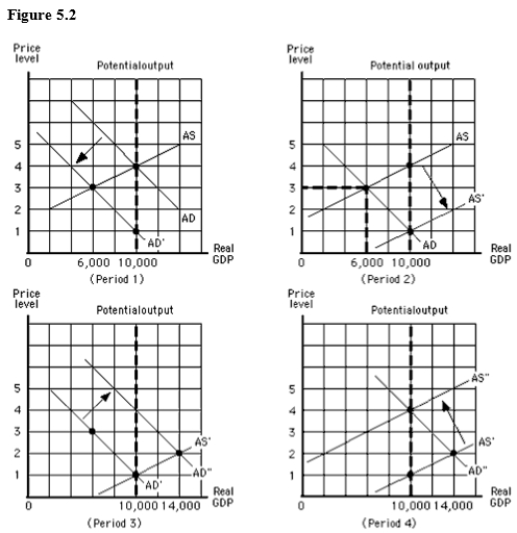
A) increases from 3 to 4.
B) decreases from 4 to 3.
C) decreases from 4 to 1.
D) increases from 1 to 4.
E) decreases from 4 to 2.
Correct Answer:
Verified
Q79: Which of these is a likely impact
Q80: Which of these is assumed to be
Q81: Which of these changes was observed in
Q82: The figure below shows the aggregate demand
Q83: The Employment Act of 1946:
A)guaranteed full employment.
B)allowed
Q85: The figure below shows the aggregate demand
Q86: According to Keynes,if private sector demand is
Q87: Keynes believed that the best method for
Q88: The figure below shows the aggregate demand
Q89: An increase in government spending,other things constant,will
Unlock this Answer For Free Now!
View this answer and more for free by performing one of the following actions

Scan the QR code to install the App and get 2 free unlocks

Unlock quizzes for free by uploading documents