The figure given below shows the income-expenditure model.At point C,_____.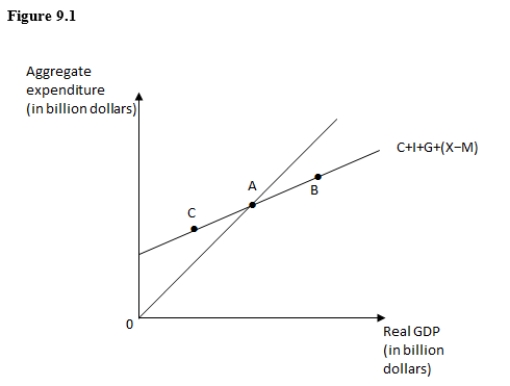
A) consumption expenditure exceeds disposable income
B) producers experience an unexpected loss of inventory
C) aggregate expenditure is exactly equal to real GDP
D) real GDP exceeds aggregate expenditure
E) producers experience an unexpected accumulation of inventory
Correct Answer:
Verified
Q75: The aggregate expenditure line is drawn on
Q76: The table given below shows the
Q77: In an economy without a government and
Q78: If incomes in the United States increase,other
Q79: The aggregate expenditure line shows total planned
Q81: Increases in the marginal propensity to consume
Q82: If households save $40 billion less at
Q83: If households save $30 billion more at
Q84: If investment increases by $100 and,as a
Q85: The table given below shows the
Unlock this Answer For Free Now!
View this answer and more for free by performing one of the following actions

Scan the QR code to install the App and get 2 free unlocks

Unlock quizzes for free by uploading documents