The figure below shows the short-run aggregate supply curve of an economy.If the actual price level exceeds the expected price level,then: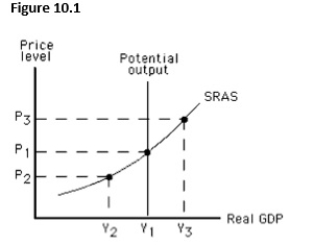
A) equilibrium output is likely to be Y2 in the short run.
B) equilibrium output is likely to be Y1 in the short run.
C) equilibrium output is likely to be Y3 in the short run.
D) potential output is greater than actual output.
E) unemployment is above the natural rate.
Correct Answer:
Verified
Q51: The figure below shows the short-run aggregate
Q52: For the aggregate demand and aggregate
Q53: When actual output increases the potential output,_.
A)more
Q54: The figure below shows the short-run aggregate
Q55: The more the short-run output exceeds an
Q57: The long run is the period of
Q58: The figure below shows the short-run aggregate
Q59: An expansionary gap is equal to:
A)real GDP
Q60: In the short run,there is a positive
Q61: The figure below shows short-run equilibrium in
Unlock this Answer For Free Now!
View this answer and more for free by performing one of the following actions

Scan the QR code to install the App and get 2 free unlocks

Unlock quizzes for free by uploading documents