The figure shows the determination of the equilibrium price level and real GDP in an aggregate demand-aggregate supply model.Which of the following economic changes is depicted by a movement from point e to point e'?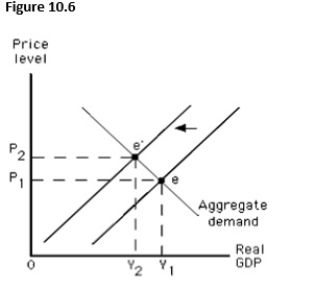
A) An increase in short-run aggregate supply
B) An increase in long-run aggregate supply
C) A decrease in short-run aggregate supply
D) A decrease in long-run aggregate supply
E) An increase in the aggregate quantity demanded
Correct Answer:
Verified
Q91: In the long run,a decrease in aggregate
Q92: A recessionary gap is usually closed in
Q93: The rate at which aggregate supply changes
Q94: Which of these changes is observed in
Q95: Which of the following is generally true
Q97: Which of the following is true in
Q98: A recessionary gap develops:
A)when actual output exceeds
Q99: When resource prices are negotiable,the long-run aggregate
Q100: The figure below shows the determination of
Q101: Which of the following is true of
Unlock this Answer For Free Now!
View this answer and more for free by performing one of the following actions

Scan the QR code to install the App and get 2 free unlocks

Unlock quizzes for free by uploading documents