The figure given below shows equilibrium in a money market.If S is the initial supply curve,the movement from S to S* can be attributed to: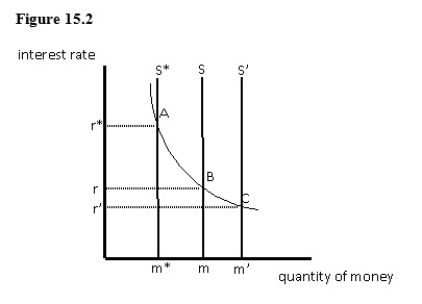
A) a decrease in the required reserve ratio.
B) the purchase of U.S.Treasury securities by the Fed.
C) the sale of U.S.Treasury securities by the Fed.
D) a decrease in the discount rate.
E) a decrease in excess reserves in the banking system.
Correct Answer:
Verified
Q51: When the Fed purchases U.S.government securities through
Q52: If the Fed decreases the money supply,gross
Q53: The demand curve for investment depicts:
A)an inverse
Q54: If the Fed increases the money supply,then:
A)the
Q55: The figure given below shows equilibrium in
Q57: Planned investment expenditures will eventually decrease after:
A)the
Q58: All other things constant,when the interest rate
Q59: In the short run,a decrease in the
Q60: The figure given below shows equilibrium in
Q61: Which of the following monetary policies would
Unlock this Answer For Free Now!
View this answer and more for free by performing one of the following actions

Scan the QR code to install the App and get 2 free unlocks

Unlock quizzes for free by uploading documents