The figure given below shows equilibrium in a money market.Which of the following will be observed if the money supply curve shifts from S to S' while the rate of interest remains at "r"?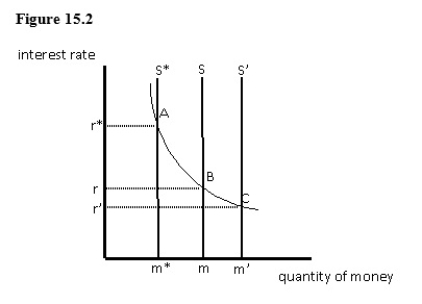
A) There will be an excess demand for money.
B) There will be an excess supply of money.
C) The Fed will buy U.S.Treasury securities.
D) The quantity of money demanded will fall.
E) The quantity of money supplied will fall.
Correct Answer:
Verified
Q37: Which of the following is not assumed
Q38: Which of the following changes will cause
Q39: The figure given below shows the interest
Q40: If the quantity of money supplied exceeds
Q41: When the Fed adopts an expansionary monetary
Q43: If the Fed purchases U.S.government securities,gross domestic
Q44: Which of these changes is likely to
Q45: In the aggregate demand-aggregate supply model in
Q46: Which of the following policies can be
Q47: In the aggregate demand-aggregate supply model in
Unlock this Answer For Free Now!
View this answer and more for free by performing one of the following actions

Scan the QR code to install the App and get 2 free unlocks

Unlock quizzes for free by uploading documents