The figure given below shows the aggregate demand curve and the short-run aggregate supply curve of an economy.In this figure,short-run equilibrium occurs at: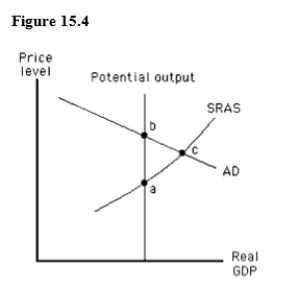
A) point b,where actual output exceeds potential output.
B) point a,where actual output exceeds potential output.
C) point c,where actual price level exceeds the expected price level.
D) point c,where the actual price level is less than the expected price level.
E) point b,where the actual price level exceeds the expected price level.
Correct Answer:
Verified
Q94: Over the past 40 years,the most frequent
Q95: Which of the following changes is observed
Q96: Which of the following identities describe the
Q97: The figure given below shows short run
Q98: If the money supply in an economy
Q100: The Fed uses the federal funds rate
Q101: The quantity theory of money states that
Q102: In an economy in which velocity of
Q103: The behavior of the M1 velocity of
Q104: A rising rate of inflation:
A)makes people more
Unlock this Answer For Free Now!
View this answer and more for free by performing one of the following actions

Scan the QR code to install the App and get 2 free unlocks

Unlock quizzes for free by uploading documents