The following graph shows the supply of and demand for baseballs in the United States.If the world price is $3 per baseball and a tariff of $1 per baseball is imposed,the net welfare loss of the tariff is shown by the area _____.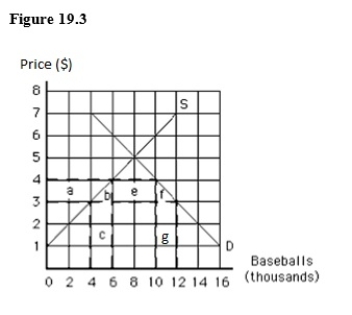
A) g
B) c
C) a
D) c and g
E) b and f
Correct Answer:
Verified
Q72: Quotas are favoured over free international trade
Q73: The following graph shows the supply of
Q74: Economists argue that U.S.government can earn federal
Q75: A legal limit on the amount of
Q76: The following graph shows the supply of
Q78: The following image shows the market for
Q79: The following graph shows the supply of
Q80: The following graph shows the demand for
Q81: The establishment of GATT resulted in:
A)lower tariff
Q82: The World Trade Organization (WTO):
A)became,in 1995,the institutionalized
Unlock this Answer For Free Now!
View this answer and more for free by performing one of the following actions

Scan the QR code to install the App and get 2 free unlocks

Unlock quizzes for free by uploading documents