The following questions refer to the graph below.
Index of Common Stock Prices (1926=100)
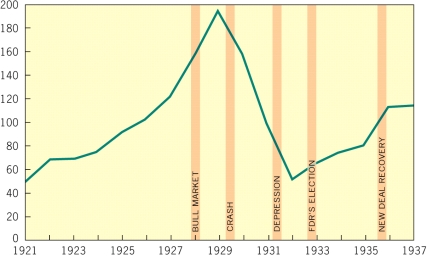
-Which of the following trends from this graph best explains the popular support of the New Deal?
A) Slow growth during the 1920s
B) Significant market instability
C) The perception of national affluence
D) Weak performance up to the outbreak of World War II
Correct Answer:
Verified
Q39: The following questions refer to the excerpt
Q40: The following questions refer to the excerpt
Q41: The following questions refer to the cartoon
Q42: The following questions refer to the graph
Q43: The following questions refer to the cartoon
Q45: The following questions refer to the graph
Q46: The following questions refer to the graph
Q47: The following questions refer to the
Q48: Directions: In your response you should do
Q49: DOCUMENT BASED
DBQ Directions
Directions: These questions
Unlock this Answer For Free Now!
View this answer and more for free by performing one of the following actions

Scan the QR code to install the App and get 2 free unlocks

Unlock quizzes for free by uploading documents