The table below shows the number of licensed hotels with at least 15 rooms in New South Wales from March 1998 to December 2009. 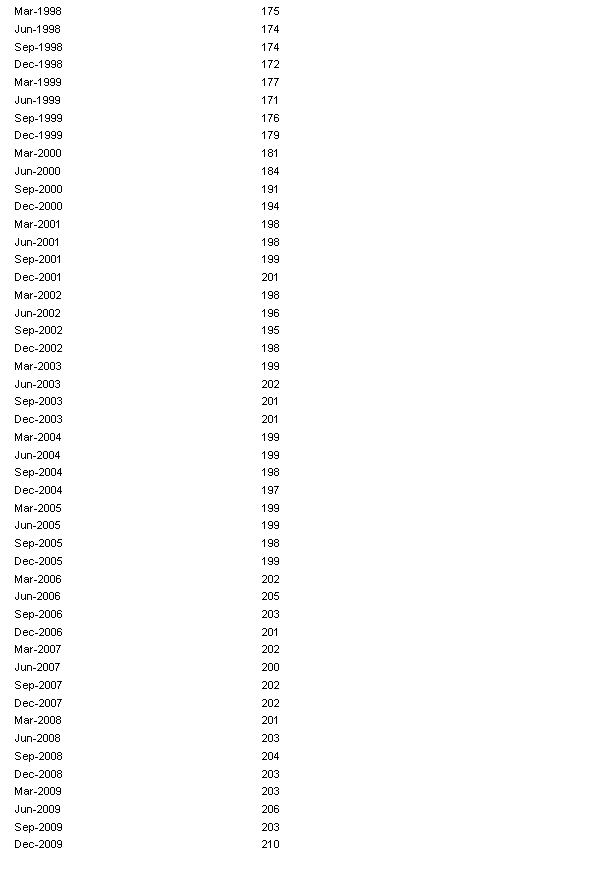 a. Plot the time series.
b. When did the number of licensed hotels with at least 15 rooms in New South Wales grow fastest?
Correct Answer:
Verified
View Answer
Unlock this answer now
Get Access to more Verified Answers free of charge
Q49: The following data are test grades
Q50: Construct a stem-and-leaf display of the
Q52: Construct an ogive for the test
Q53: The frequency distribution of the number
Q54: Graphical excellence is displayed when a graph
Q55: For a bar chart to show graphical
Q56: The relationship between expenditure on imports and
Q56: Describe briefly what the histogram and
Q57: Construct a frequency distribution and relative
Q58: The weights in kilograms of a sample
Unlock this Answer For Free Now!
View this answer and more for free by performing one of the following actions

Scan the QR code to install the App and get 2 free unlocks

Unlock quizzes for free by uploading documents