Figure 6-3
This figure shows the market demand and market supply curves for good Z. 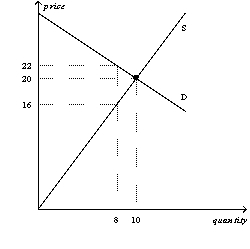
-Refer to Figure 6-3.Suppose a tax of $3 per unit is imposed on this market.What will be the new equilibrium quantity in this market?
A) less than 8 units
B) 8 units
C) between 8 units and 10 units
D) greater than 10 units
Correct Answer:
Verified
Q167: Does a binding price ceiling result in
Q168: Define a price floor.
Q172: Define a price ceiling.
Q175: When a price ceiling is binding, is
Q574: Figure 6-2
This figure shows the market demand
Q575: Figure 6-3
This figure shows the market demand
Q577: Figure 6-2
This figure shows the market demand
Q578: Figure 6-3
This figure shows the market demand
Q580: Figure 6-3
This figure shows the market demand
Q581: Figure 6-5 ![]()
Unlock this Answer For Free Now!
View this answer and more for free by performing one of the following actions

Scan the QR code to install the App and get 2 free unlocks

Unlock quizzes for free by uploading documents