Figure 9-1
The figure illustrates the market for wool in Scotland.
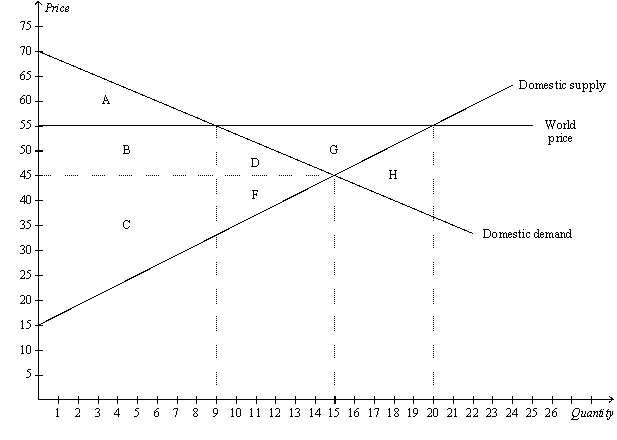
-Refer to Figure 9-1.When trade is allowed,
A) Scotland producers of wool become better off and Scotland consumers of wool become worse off.
B) Scotland consumers of wool become better off and Scotland producers of wool become worse off.
C) both Scotland producers and consumers of wool become better off.
D) both Scotland producers and consumers of wool become worse off.
Correct Answer:
Verified
Q26: Which of the following statements is true?
A)Free
Q35: Suppose a country begins to allow international
Q37: After a country goes from disallowing trade
Q67: Figure 9-1
The figure illustrates the market for
Q68: Figure 9-1
The figure illustrates the market for
Q70: Assume,for the U.S.,that the domestic price of
Q71: Figure 9-1
The figure illustrates the market for
Q75: Figure 9-1
The figure illustrates the market for
Q76: Figure 9-1
The figure illustrates the market for
Q77: The world price of a simple electronic
Unlock this Answer For Free Now!
View this answer and more for free by performing one of the following actions

Scan the QR code to install the App and get 2 free unlocks

Unlock quizzes for free by uploading documents