Figure 9-19.On the diagram below,Q represents the quantity of textiles and P represents the price of textiles. 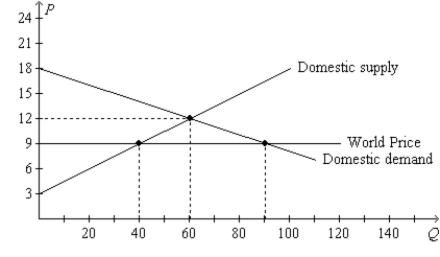
-Refer to Figure 9-19.With free trade,consumer surplus in the textile market amounts to
A) $210.
B) $320.
C) $405.
D) $910.
Correct Answer:
Verified
Q189: Figure 9-6 Q193: Figure 9-6 Q227: Japan imposes a $300 per ton tariff Q228: Domestic producers of a good become worse Q229: If Freedonia changes its laws to allow Q230: Denmark is an importer of computer chips Q231: When a country abandons a no-trade policy,adopts Q235: When a country abandons a no-trade policy,adopts Q236: When a country abandons a no-trade policy,adopts Q237: When a country that exported a particular![]()
![]()
Unlock this Answer For Free Now!
View this answer and more for free by performing one of the following actions

Scan the QR code to install the App and get 2 free unlocks

Unlock quizzes for free by uploading documents