Figure 9-1
The following diagram shows the domestic demand and domestic supply for a market.In addition,assume that the world price in this market is $40 per unit. 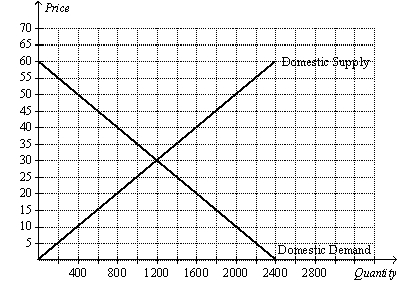
-Refer to Figure 9-1.With free trade,domestic production and domestic consumption,respectively,are
A) 1,200 and 800.
B) 1,600 and 1,200.
C) 1,600 and 800.
D) 1,200 and 1,200
Correct Answer:
Verified
Q62: Suppose in the country of Jumanji that
Q122: What are the arguments in favor of
Q211: If the United States threatens to impose
Q401: Figure 9-1
The following diagram shows the domestic
Q403: Assume for the U.S.that the domestic price
Q405: Figure 9-1
The following diagram shows the domestic
Q407: Figure 9-2
The following diagram shows the domestic
Q408: Figure 9-2
The following diagram shows the domestic
Q410: Figure 9-1
The following diagram shows the domestic
Q411: Figure 9-2
The following diagram shows the domestic
Unlock this Answer For Free Now!
View this answer and more for free by performing one of the following actions

Scan the QR code to install the App and get 2 free unlocks

Unlock quizzes for free by uploading documents