Figure 9-2
The following diagram shows the domestic demand and domestic supply in a market.In addition,assume that the world price in this market is $40 per unit. 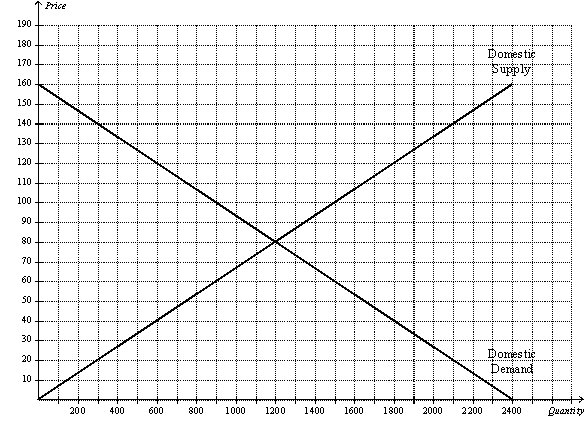
-Refer to Figure 9-2.Suppose the government imposes a tariff of $20 per unit.The deadweight loss caused by the tariff is
A) $6,000.
B) $9,000.
C) $12,000.
D) $15,000.
Correct Answer:
Verified
Q66: Suppose in the country of Nash that
Q72: Suppose in the country of Jumanji that
Q415: Figure 9-2
The following diagram shows the domestic
Q416: Figure 9-2
The following diagram shows the domestic
Q419: Figure 9-1
The following diagram shows the domestic
Q421: Scenario 9-1
Suppose domestic demand and domestic supply
Q422: Scenario 9-1
Suppose domestic demand and domestic supply
Q423: Figure 9-3
The following diagram shows the domestic
Q424: Scenario 9-1
Suppose domestic demand and domestic supply
Q425: Figure 9-4
The following diagram shows the domestic
Unlock this Answer For Free Now!
View this answer and more for free by performing one of the following actions

Scan the QR code to install the App and get 2 free unlocks

Unlock quizzes for free by uploading documents