Figure 15-2
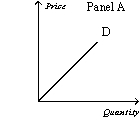
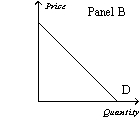
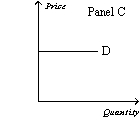
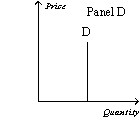
-Refer to Figure 15-2.Which panel could represent the demand curve facing the soybean industry?
A) Panel A
B) Panel B
C) Panel C
D) Panel D
Correct Answer:
Verified
Q121: Figure 15-2 Q123: A monopoly firm can sell 150 units Q124: A monopolist can sell 200 units of Q125: Figure 15-3 Q319: A monopolist's average revenue is always Q326: Marginal revenue can become negative for Q328: For a monopolist, when the output effect Q330: For a monopolist, when the price effect Q349: If a monopolist has zero marginal costs, Q389: The marginal revenue curve for a monopoly
![]()
![]()
A)equal to
A)both competitive
Unlock this Answer For Free Now!
View this answer and more for free by performing one of the following actions

Scan the QR code to install the App and get 2 free unlocks

Unlock quizzes for free by uploading documents