Multiple Choice
Figure 16-1. The figure is drawn for a monopolistically competitive firm.
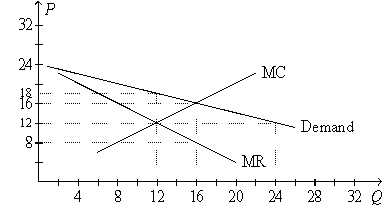
-Refer to Figure 16-1.Suppose you were to add the ATC curve to the diagram to show the firm in a situation of long-run equilibrium.You would draw the ATC curve
A) with its minimum at the point (Q = 12, P = $18) .
B) with its minimum at the point (Q = 12, P = $12) .
C) tangent to the demand curve at the point (Q = 12, P = $18) .
D) tangent to the demand curve at the point (Q = 16, P = $16) .
Correct Answer:
Verified
Related Questions
Q135: Figure 16-1. The figure is drawn for
Q137: Figure 16-1. The figure is drawn for
Q138: Figure 16-1. The figure is drawn for
Q140: Figure 16-1. The figure is drawn for

