Figure 16-2 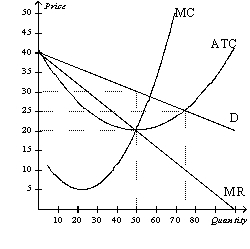
-Refer to Figure 16-2.The graph depicts a monopolistically competitive firm in the short run.Which of the following explanations best decribes the long run adjustment?
A) More firms will enter this market and each firm will have a smaller share of the total market demand,shifting this firm's demand curve to the left.
B) More firms will enter this market and each firm will have a larger share of the total market demand,shifting this firm's demand to the right.
C) Firms will exit this market and each firm will have a smaller share of the total market demand,shifting this firm's demand to the left.
D) Firms will exit this market and each firm will have a larger share of the total market demand,shifting this firm's demand to the right.
Correct Answer:
Verified
Q61: Suppose there is a market in which
Q75: Which market structure(s) is(are) considered highly concentrated?
Q146: In markets where the government imposes an

