Figure 19-1
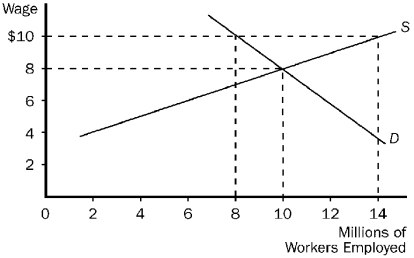
-Refer to Figure 19-1.Suppose the local labor market was in equilibrium to begin with but then the largest local employer decided to change its compensation scheme to $10 as shown.Which of the following compensation schemes could the graph be illustrating?
A) An efficiency wage.
B) Discrimination.
C) A compensating differential.
D) The superstar phenomenon.
Correct Answer:
Verified
Q183: Figure 19-3
The manufacturing labor market.

Q188: Figure 19-1 Q189: Figure 19-2 Q192: Figure 19-3 Q391: Which of the following is not a Q402: Which of the following is true of Q415: Studies have shown that union workers earn Q417: First grade teachers who work in Lynn, Q426: A union's major source of power is Q440: Which of the following is not an
![]()
![]()
The manufacturing labor market.
Unlock this Answer For Free Now!
View this answer and more for free by performing one of the following actions

Scan the QR code to install the App and get 2 free unlocks

Unlock quizzes for free by uploading documents