Solved
Figure 21-19 The Following Graph Illustrates a Representative Consumer's Preferences for Marshmallows
Multiple Choice
Figure 21-19
The following graph illustrates a representative consumer's preferences for marshmallows and chocolate chip cookies:
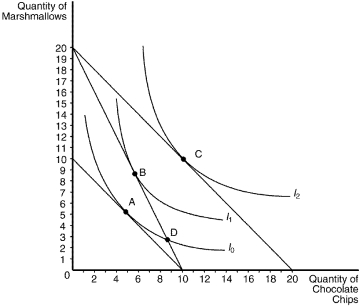
-Refer to Figure 21-19.Assume that the consumer has an income of $40,the price of a bag of marshmallows is $2,and the price of a bag of chocolate chips is $2.The optimizing consumer will choose to purchase which bundle of marshmallows and chocolate chips?
A) A
B) B
C) C
D) D
Correct Answer:
Verified
Related Questions

