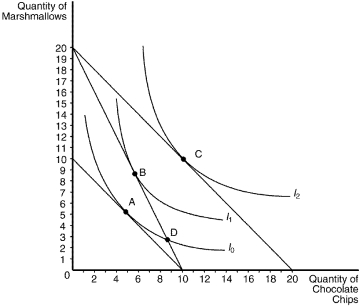
Figure 21-19 The Following Graph Illustrates a Representative Consumer's Preferences for Marshmallows
Figure 21-19
The following graph illustrates a representative consumer's preferences for marshmallows and chocolate chip cookies:

-Refer to Figure 21-19.Assume that the consumer has an income of $40.If the price of chocolate chips is $4 and the price of marshmallows is $4,the optimizing consumer would choose to purchase
A) 9 marshmallows and 6 chocolate chips.
B) 10 marshmallows and 10 chocolate chips.
C) 5 marshmallows and 5 chocolate chips.
D) 3 marshmallows and 9 chocolate chips.
Correct Answer:
Verified
Q168: When considering her budget, the highest indifference
Q213: Figure 21-15 Q214: Figure 21-18 Q215: Figure 21-15 Q216: Figure 21-16 Q217: Figure 21-18 Q219: Figure 21-19 Unlock this Answer For Free Now! View this answer and more for free by performing one of the following actions Scan the QR code to install the App and get 2 free unlocks Unlock quizzes for free by uploading documents
![]()
![]()
![]()
![]()
![]()
The following graph illustrates a representative

