Figure 21-22
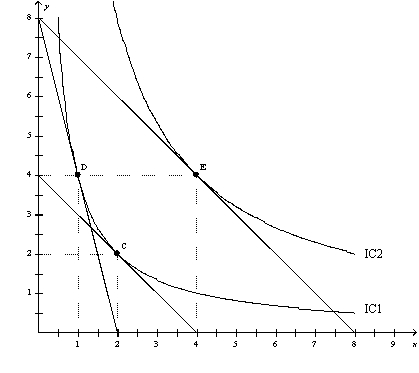
-Refer to Figure 21-22.When the price of X is $80,the price of Y is $20,and the consumer's income is $160,the consumer's optimal choice is D.Then the price of X decreases to $20.The substitution effect can be illustrated as the movement from
A) D to E.
B) D to C.
C) C to E.
D) E to D.
Correct Answer:
Verified
Q67: Giffen goods have positively-sloped demand curves because
Q95: Two economists found empirical evidence that when
Q98: The two "goods" used when economists analyze
Q242: Which of the following descriptions best depicts
Q246: An individual's demand curve for a good
Q249: Which effect of a price change moves
Q251: When we derive the demand curve for
Q253: A consumer consumes two normal goods, sandwiches
Q255: Pepsi and pizza are normal goods. When
Q342: Figure 21-23
![]()
Unlock this Answer For Free Now!
View this answer and more for free by performing one of the following actions

Scan the QR code to install the App and get 2 free unlocks

Unlock quizzes for free by uploading documents