Figure 21-1.The figure shows three indifference curves and a budget constraint for a certain consumer named Jack. 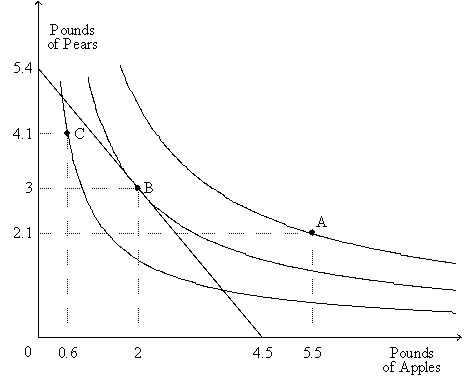
-Refer to Figure 21-1.About what percentage of his income is Jack spending on apples when he is at his optimum?
A) 33.3 percent
B) 38.2 percent
C) 44.4 percent
D) 56.7 percent
Correct Answer:
Verified
Q67: When we draw Katie's indifference curves to
Q77: If the market is offering consumers the
Q465: Figure 21-1.The figure shows three indifference curves
Q466: Figure 21-1.The figure shows three indifference curves
Q467: Figure 21-2.The graph shows two budget constraints
Q468: Figure 21-1.The figure shows three indifference curves
Q469: Figure 21-2.The graph shows two budget constraints
Q471: Figure 21-1.The figure shows three indifference curves
Q474: Figure 21-1.The figure shows three indifference curves
Q475: Figure 21-2.The graph shows two budget constraints
Unlock this Answer For Free Now!
View this answer and more for free by performing one of the following actions

Scan the QR code to install the App and get 2 free unlocks

Unlock quizzes for free by uploading documents