Figure 19-4 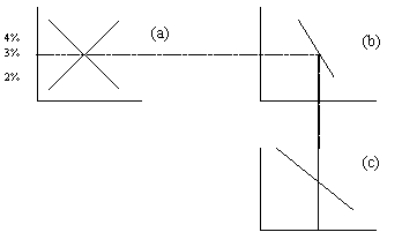
-Refer to Figure 19-4. Suppose that the government goes from a budget surplus to a budget deficit. The effects of the change could be illustrated by
A) shifting the demand curve in panel a to the right and the demand curve in panel c to the left.
B) shifting the demand curve in panel a to the left and the supply curve in panel c to the left.
C) shifting the supply curve in panel a to the right and the demand curve in panel c to the right.
D) shifting the supply curve in panel a to the left and the supply curve in panel c to the left.
Correct Answer:
Verified
Q49: From 1980 to 1987,U.S.net capital outflows decreased.According
Q51: From 2001 to 2004,the U.S.government went from
Q55: Which of the following contains a list
Q57: In the United States in the early
Q60: Which of the following contains a list
Q70: A limit on the quantity of a
Q74: Suppose that the United States imposes an
Q77: If the U.S.were to impose import quotas
A)the
Q217: Figure 19-4 Q220: In the 1980s, the U.S. government budget![]()
Unlock this Answer For Free Now!
View this answer and more for free by performing one of the following actions

Scan the QR code to install the App and get 2 free unlocks

Unlock quizzes for free by uploading documents