Which of the following inferences about a variable of interest can be drawn from the graph given below? 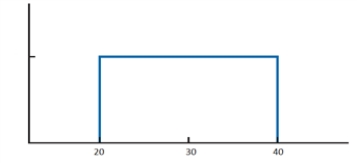
A) The variable is equally likely to take any value between 20 and 40.
B) The variable is more likely to take the value 20 than 40.
C) The variable is more likely to take any value outside the range of 20 and 40.
D) The variable can only take the value 30.
Correct Answer:
Verified
Q4: A _ uses repeated random sampling to
Q5: The values for random variables in a
Q6: In reviewing the graph below, which of
Q6: A distribution of a random variable for
Q10: The range of computer-generated random numbers is
A)[-8,
Q11: A _ analysis involves considering alternative values
Q12: A(n) _ is an input to a
Q18: A disadvantage of the simple what-if analyses
Q19: In simulation analysis, the _ of random
Q20: The outcome of a simulation experiment is
Unlock this Answer For Free Now!
View this answer and more for free by performing one of the following actions

Scan the QR code to install the App and get 2 free unlocks

Unlock quizzes for free by uploading documents