The type of distribution shown in the graph below is 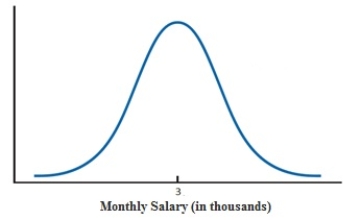
A) uniform.
B) normal.
C) exponential.
D) beta.
Correct Answer:
Verified
Q2: An input to a simulation model that
Q4: A _ uses repeated random sampling to
Q5: The values for random variables in a
Q6: A distribution of a random variable for
Q9: A description of the range and relative
Q11: A _ analysis involves considering alternative values
Q13: A simulation model extends spreadsheet modeling by
A)extending
Q16: The process of evaluating a decision in
Q17: In a _, a random variable can
Q17: The choice of the probability distribution for
Unlock this Answer For Free Now!
View this answer and more for free by performing one of the following actions

Scan the QR code to install the App and get 2 free unlocks

Unlock quizzes for free by uploading documents