Consider the table below with information regarding each activity, immediate predecessors, and duration estimates (in minutes) for each activity. 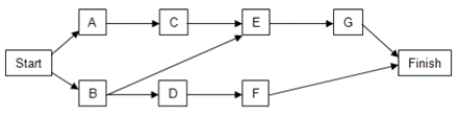
a. Using the PERT distribution in ASP to represent the duration of each activity, construct a simulation model to compute the total time to complete the task.
b. What is the expected duration of the entire project? What is the standard deviation of the project duration?
c. What is the likelihood that the project will be complete in 26 minutes?
Correct Answer:
Verified
View Answer
Unlock this answer now
Get Access to more Verified Answers free of charge
Q41: A store is offering a discount
Q42: Salemach Corporation is a start-up company
Q43: The quality of a device should
Q44: The stock price of Robin Tires,
Q45: An Investment firm offers free financial planning
Q47: A specialty hedge fund is considering
Q48: A company has produced a new battery
Q49: The manager of a company decides
Q50: A football tournament is conducted between
Q51: An entrepreneur who operates a cellular
Unlock this Answer For Free Now!
View this answer and more for free by performing one of the following actions

Scan the QR code to install the App and get 2 free unlocks

Unlock quizzes for free by uploading documents