A time series plot of a period of time (in weeks) verses sales (in 1,000's of gallons) is shown below. Which of the following data patterns best describes the scenario shown? 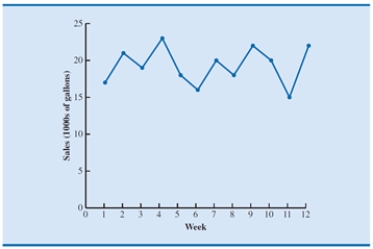
A) Time series with a linear trend pattern
B) Time series with a nonlinear trend pattern
C) Time series with no pattern
D) Time series with a horizontal pattern
Correct Answer:
Verified
Q6: With reference to time series data patterns,
Q7: An exponential trend pattern occurs when
A)the amount
Q9: A forecast is defined as a(n)
A)prediction of
Q10: Which is not true regarding trend patterns?
A)Can
Q13: A time series plot of a period
Q15: A time series that shows a recurring
Q17: A set of observations on a variable
Q19: Forecast error
A)takes a positive value when the
Q20: If the forecasted value of the time
Q21: Suppose for a particular week, the forecasted
Unlock this Answer For Free Now!
View this answer and more for free by performing one of the following actions

Scan the QR code to install the App and get 2 free unlocks

Unlock quizzes for free by uploading documents