Multiple Choice
The following image is a 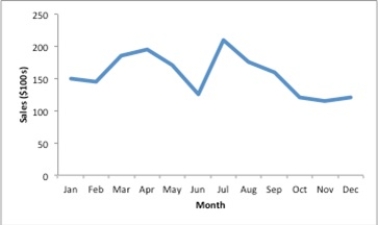
A) sparkline.
B) trendline.
C) gridline.
D) line chart.
Correct Answer:
Verified
Related Questions
Q1: The charts that are helpful in making
Q3: A time series plot is also known
Q4: A chart that is recommended as an
Q8: A _ is a line that provides
Q12: Data-ink is the ink used in a
Q21: Consider the clustered bar chart of the
Q21: We create multiple dashboards
A)to help the user
Q24: The following table is an example
Q25: A data visualization tool that updates in
Q36: A _ is used for examining data
Unlock this Answer For Free Now!
View this answer and more for free by performing one of the following actions

Scan the QR code to install the App and get 2 free unlocks

Unlock quizzes for free by uploading documents